デジタルマーケティングエンジニア 西村 彰悟のコラム「Chromeデベロッパーツールの使い方 Networkパネルを使い倒す」をデジタルマーケティングエンジニア JAIN Vibhor が英訳したものになります。
Chrome DevTools is a great tool integrated into Google Chrome browser to assist in web development.
If you set-up website traffic measurement tags such as Google Analytics or conduct site checks for SEO, chances are you already use it. Familiarize with the various features of this tool can improve the accuracy and efficiency of your testing, troubleshooting work.
In this article, introduce a range of features that can be utilized for inspecting network communication using the ‘Network’ tab in Chrome DevTools.
- How to Access Chrome DevTools
- Basic Usage of the Network panel
- Inspect the communication of a mobile-specific page
- To filter and examine network traffic
- Block specific traffic
- Identifying the Source of Communication
- Functions for Each Control in the Network Panel
- Conclusion
1. How to Access Chrome DevTools
In order to access Chrome DevTools, right-clicking on a web page in the Chrome browser and select ‘Inspect’ from the context menu that appears.
(Alternatively, use F12 key on Windows or (Command + Option + I) keys on Mac.)
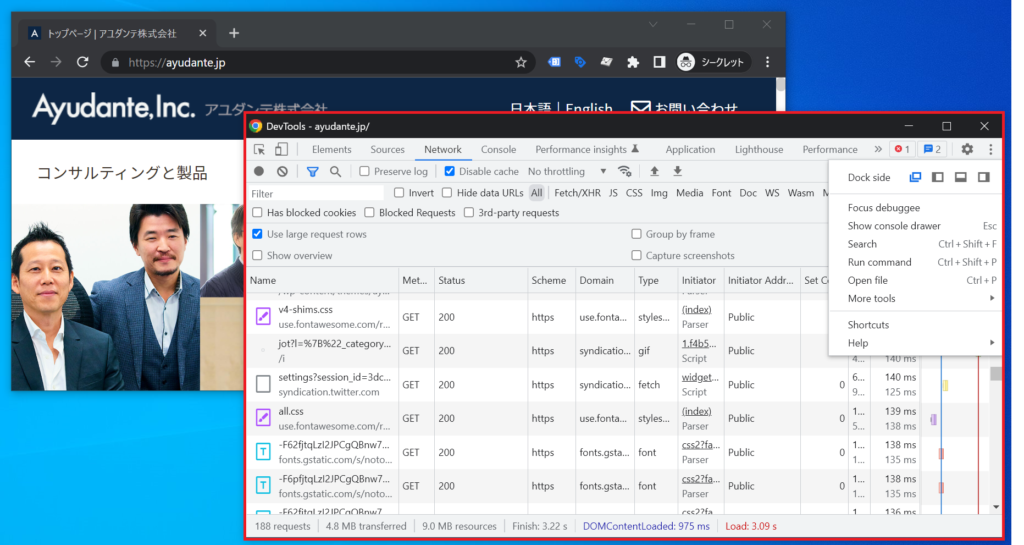
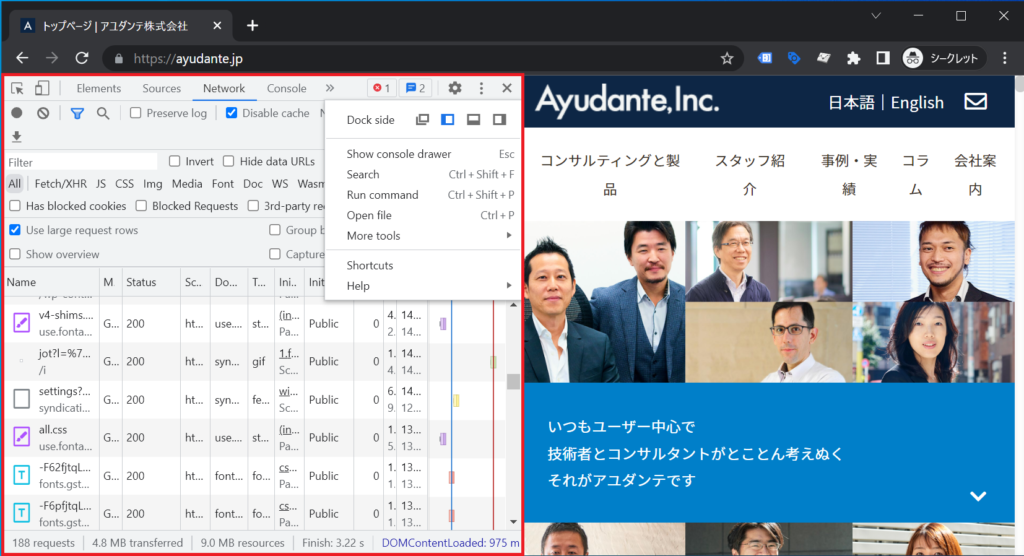
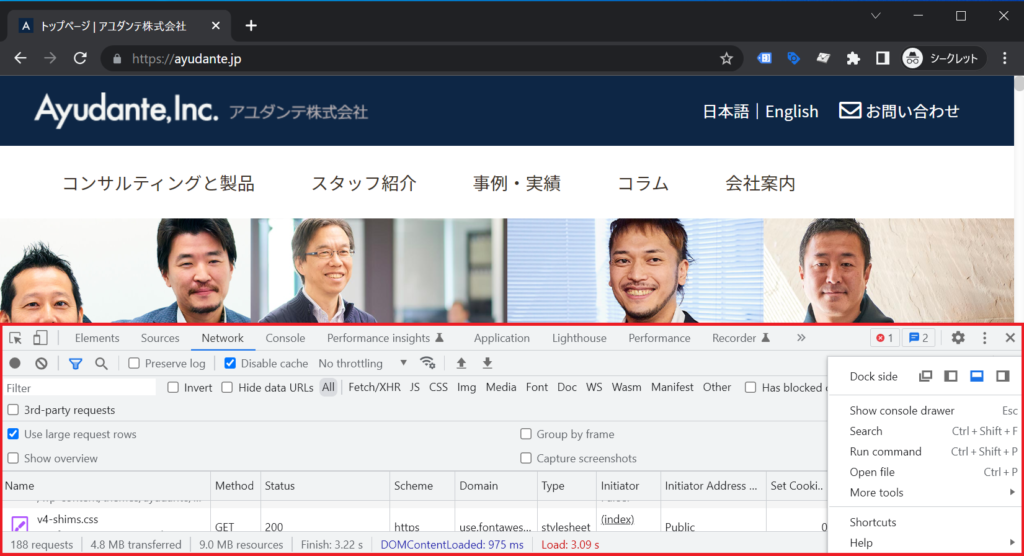
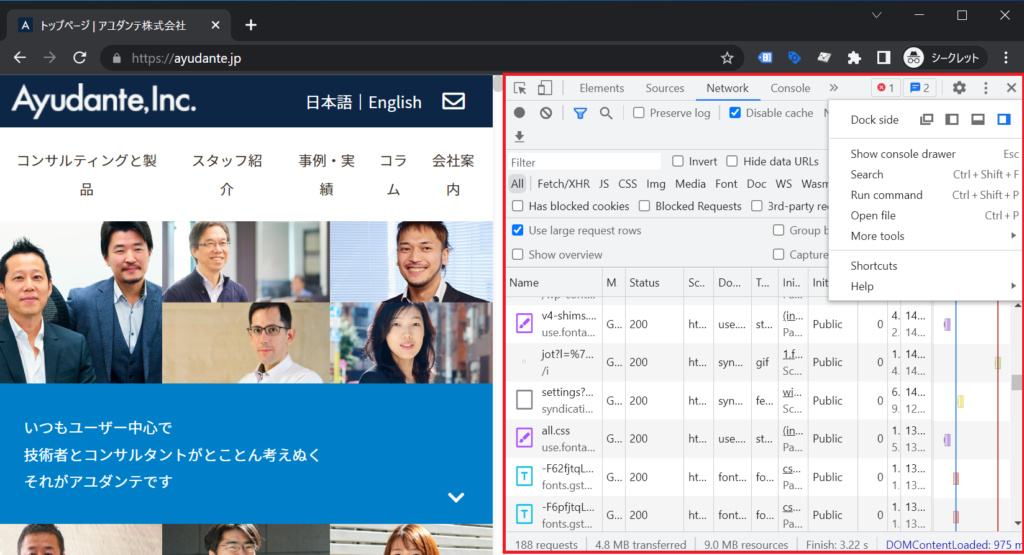
Change the Display Position
You can change the display position by clicking the triple dots’︙’ menu in the top right corner and selecting ‘Dock side‘ from the menu that appears at the top.”
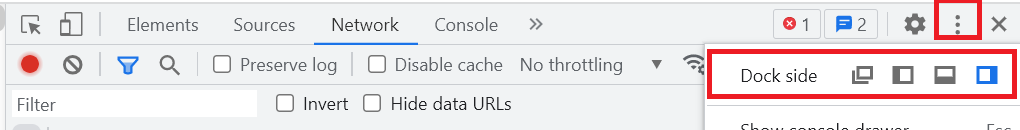
Possible Dockside positions:
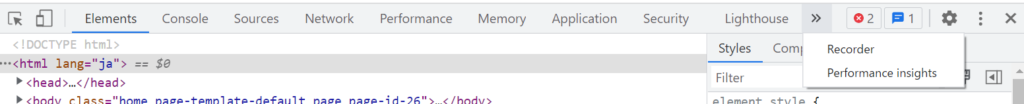
Overview of Each Feature:
Access main features from the top tabs in the tool window, ex. ‘Elements,’ ‘Console,’ and so on.
Elements: you can inspect the page content rendered in HTML. It reflects any content modified by JavaScript. You can investigate how each element is styled, which events they respond to, and which code is executed.
Console: you can view log output from the browser. You can also execute JavaScript code in a simplified manner.
Source: allows you to examine resource details loaded by the browser, such as that of HTML files, .js files. You can temporarily pause JavaScript execution during specific processes or event execution to perform detailed inspections.
Network: Inspect the network communication executed by the browser within the page.
Performance: Thoroughly examine factors that slow down page loading or affect Core Web Vitals metrics.
Application: View, edit, and delete various browser storage like Cookies, Local Storage, Session Storage which may be exchanged within the page.
Lighthouse: Perform page quality evaluation tests. Unlike PageSpeed Insights, it can execute on unpublished pages as well.
Recorder: Record and replay operations such as clicks and inputs on the page for performance investigation.
Performance insights: Easier site performance analysis than the Performance panel. It provides more succinct information, making it more accessible to a wider audience.
In this article, we will focus on the features of the ‘Network’ panel.
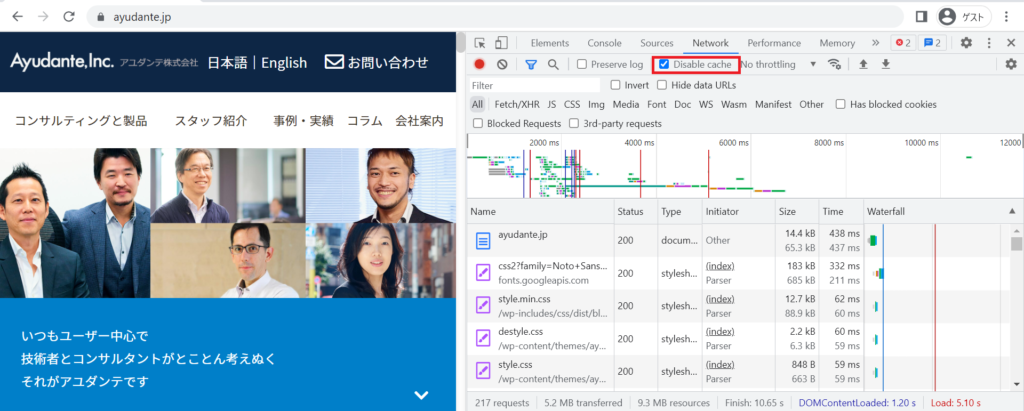
2. Basic Usage of the Network panel
By clicking on the ‘Network’ panel among the panels at the top of Chrome DevTools, you can open the Network panel. In this screen, you can review the network communication executed by the browser within the page.
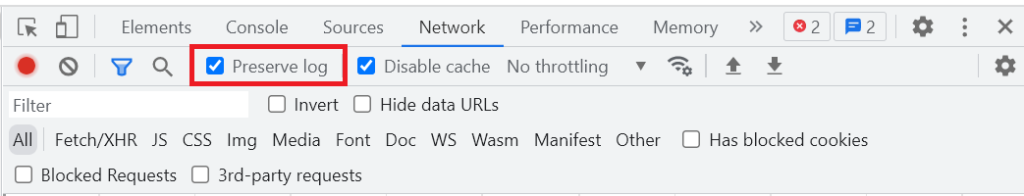
During troubleshooting, it is recommended to check ‘Disable cache’ to disable browser caching.
To prevent logs from being cleared when navigating pages ,you can perform your troubleshooting by checking the ‘Preserve log’ option in the Network panel. By default, the communication logs displayed in the Network panel are cleared when the page is refreshed. However, when you want to view the logs that persist across page loads and span across pages, it is recommended to enable the ‘Preserve log’ option.
To view detailed information about the communication logs, you can right-click on the row cell of each row, and it will display the details of the communication.”
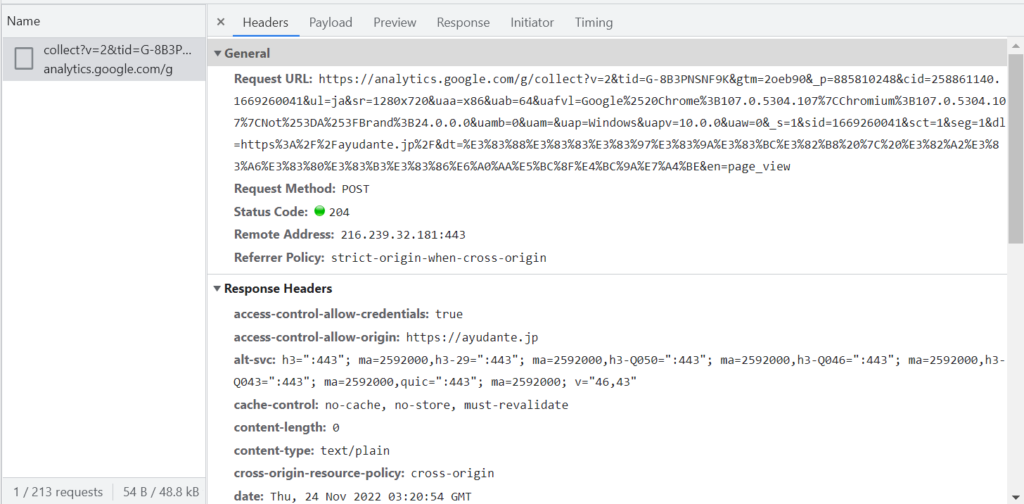
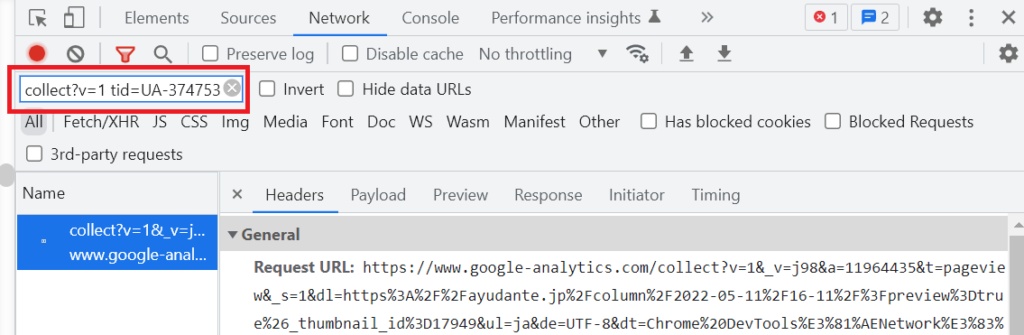
The screenshot above shows the network request of the GA4 tag to Google’s collection server. The Request URL parameters contain a lot of information, but if you want to view them in a more readable format, you can open the ‘Payload’ tab and click on “view URL-decoded“.
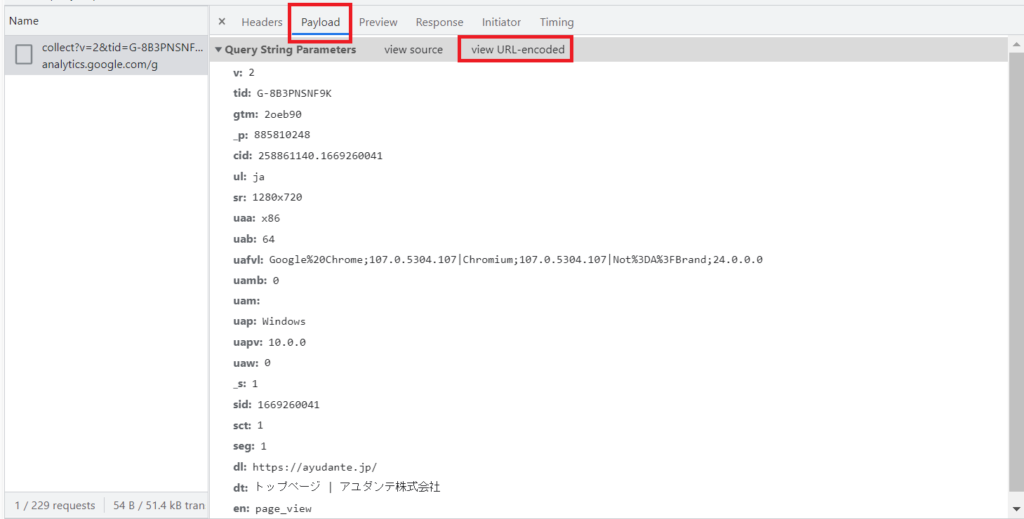
In this screenshot, we can notice that the GA4 measurement tag is sending the event named ‘page_view’ along with parameters such as the URL of the page where the tag fired (&dl) and the page title (&dt) to Google’s server.
For more detailed information about the communication content of the GA4 measurement tag, you can refer to the following resource: ‘Google Analytics 4. Measurement Protocol Definition – Web Analyst and Sr. Implementation Consultant – David Vallejo’.”
Overview of each tab in the detailed View of network request content
Headers: General information sent by the browser to the server (Request URL), Request Headers, the information returned by the server to the browser (Response Headers), and the status code.
Payload: You can view the parameters included in the Request URL in a readable format. Clicking ‘view decoded’ allows you to see the URL-decoded content in a readable form.
Preview: You can preview resources such as images returned by the request.
Response: You can view the content of HTML or JS files returned by the server, as well as API response information.
Initiator: You can examine the chain of requests and code that triggered this network request and view other requests generated as a result of this request.
Timing: You can check the timeline of the request (Queued at, Start at etc.), as well as how time was spent during that period. Please refer to the relevant documentation for the meaning of each timing.
Cookies: you can see the cookies sent by the browser to the server, and in ‘Response Cookies,’ you can view the cookies set by the server on the browser.”
3. Inspect the communication of a mobile-specific page
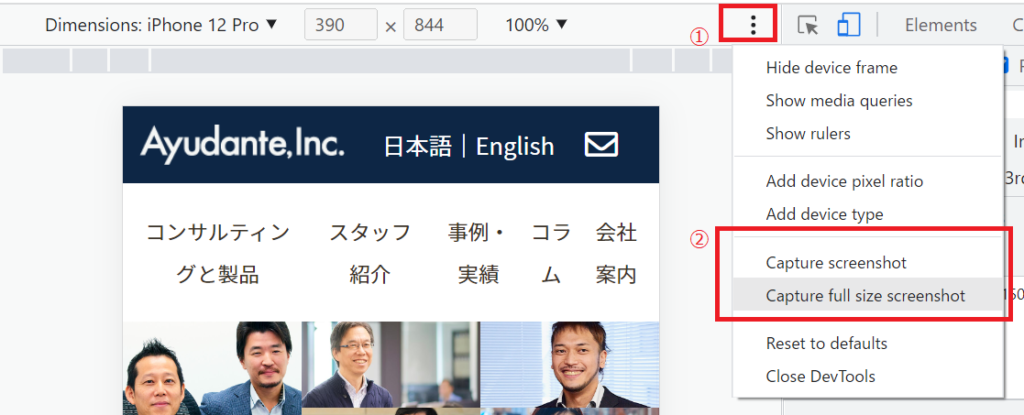
When you want to inspect the request on the mobile view of the page, start the Device Emulation mode from the top-left corner of the Developer Tools. Select the device to emulate, the screen width and User-Agent string will be changed. For example, you can access the site pretending to be an ‘iPhone 12 Pro.’ This allows you to examine the communication of the page as it would appear on a specific mobile device.”
SS-7 (mobile view)
Tip: By clicking the ‘Edit…’ menu at the bottom of the device list, you can enable emulation of a wide range of devices that are not displayed by default. You can also register your own custom devices with specific screen width and User-Agent.
From the Device Emulation screen, you can capture screenshots and save it.
Notes on Device Emulation:
If you have previously opened the website you are testing, the browser’s cookies and cache may persist the information from when you accessed the desktop version of the site, causing issues with the mobile version’s correct functionality.
In such cases, you can do either of the following: a) Open the page in Chrome’s Guest Mode, or b) Incognito Mode while emulating a specific device.
- Browse Chrome as a guest https://support.google.com/chrome/answer/6130773
- Browse in private https://support.google.com/chrome/answer/95464
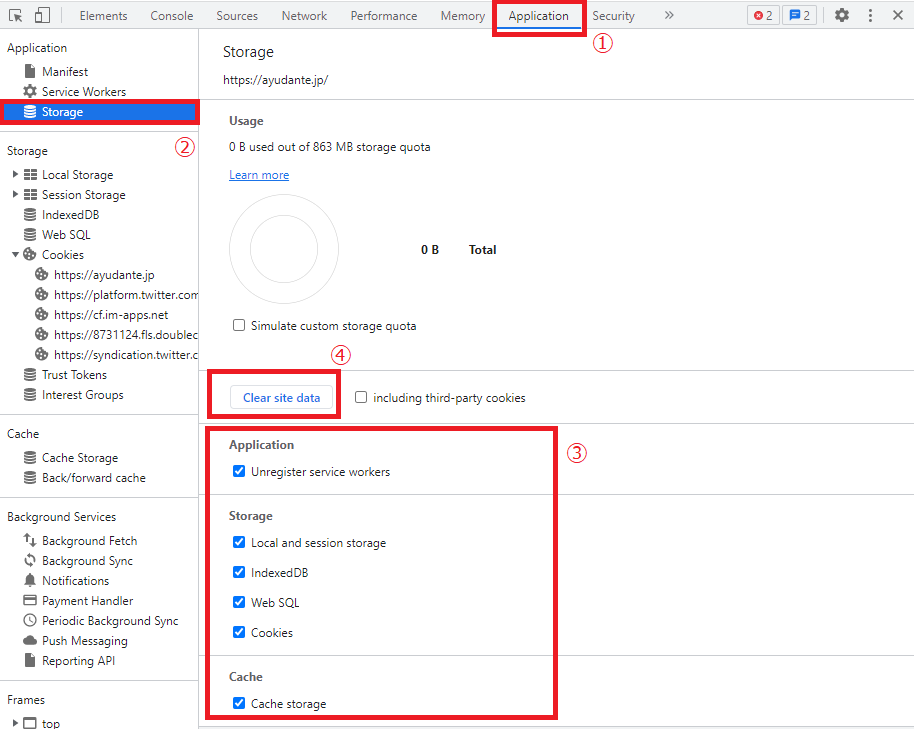
While the page is open, access the top menu and follow these steps:
- Open the ‘Application’ panel.
- Open the ‘Storage’ menu.
- Check all the items related to the domain you are testing.
- Click ‘Clear site data’ to delete the browser’s stored information.
After performing these steps, you can proceed with your testing to ensure accurate results.
4. Filter the network traffic
By entering filter keywords in the filter text box located at the top left of the Network panel, you can filter and display the network traffic based on a specific Request URL. While this feature itself is well-known, did you know that you can perform an AND search using multiple keywords separated by space?
For example, if you want to narrow down to specific Universal Analytics properties, you can filter through “collect?v=1 tid=UA-374753-4”.
Additionally, you can enclose keywords by “/” (slash) symbol to perform filtering based on regular expressions. This technique is useful when you want to perform more complex extractions and it also supports negative lookaheads.
Strings contained in the request for Google Analytics page view hit:
- Universal Analytics: collect?v=1 t=pageview
- GA4: collect?v=2 en=page_view
※ For GA4 tags, by default, multiple events are grouped together and sent in batches. Therefore, if you want to monitor them in real-time, you need to take additional steps such as running GTM preview mode or enabling Google Analytics Debugger.
You can perform additional filtering using commands, such as status-code:404.
5. Block specific traffic
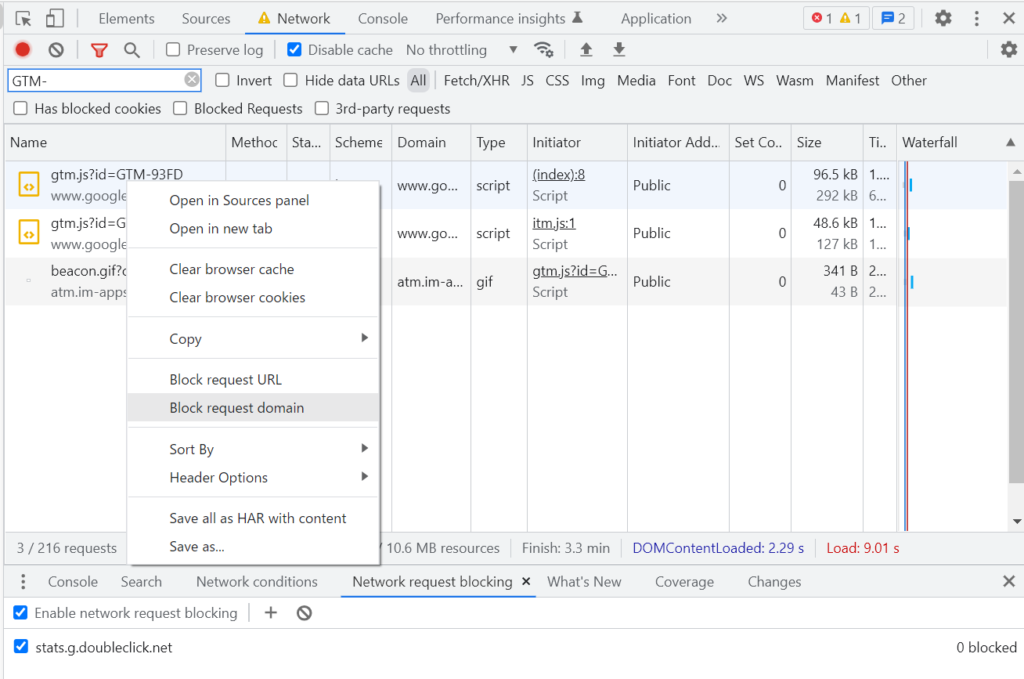
If you suspect that a specific tracking tag is causing issues on your website, you can use Chrome DevTools to block the network requests and investigate the impact on the site. For example, by blocking GTM (Google Tag Manager) requests and then reloading the page, you can investigate if the
1. Right-click on the log entry of the network request that you want to block, from the context menu select either “Block request URL” or “Block request domain”.
2. Reload the page to see if the intended request is being blocked. Check if the issue continues to occur even after blocking the request.
Blocked requests can be filtered and displayed by checking the “Blocked Request” check-box.
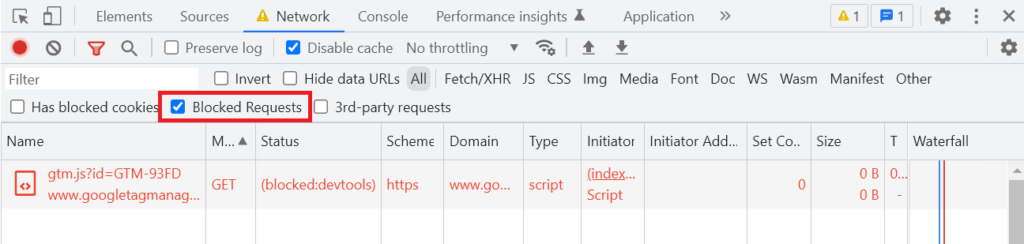
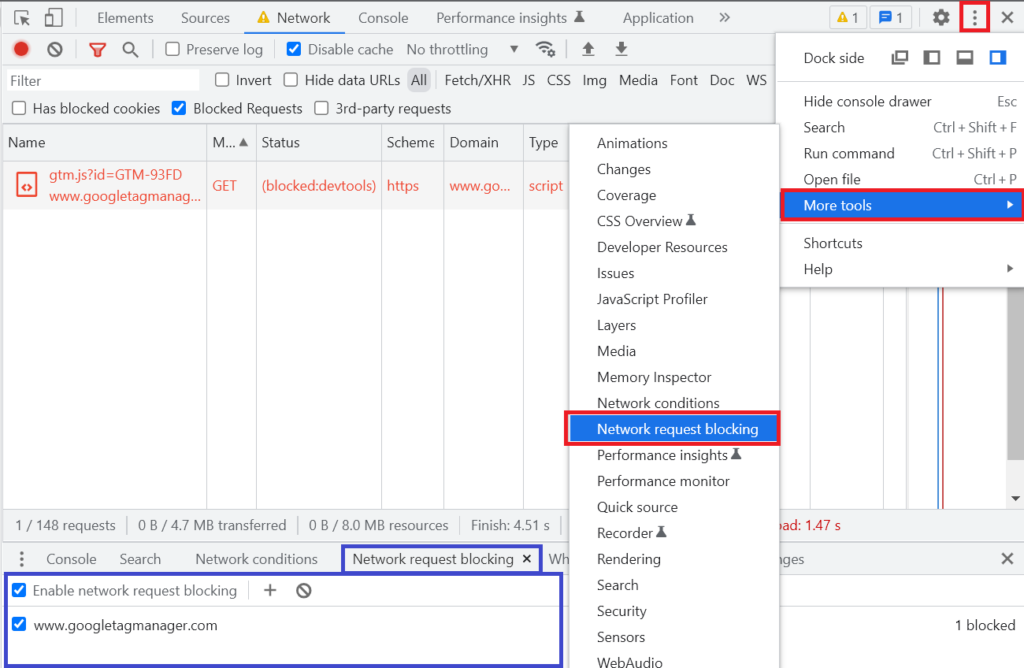
- When the Status column is “(blocked:devtools)”: request blocked by Chrome DevTools settings.
- When the Status is “(blocked:csp)”: request blocked by the site’s Content-Security-Policy.
You can check and modify the settings for blocked requests by clicking the vertical ellipsis (︙) in the upper right corner, select “More tools” -> “Network request blocking” from the menu. This will display the “Network request blocking” tab in the lower menu, where you can review and make changes.
6. Identifying the Source of Communication
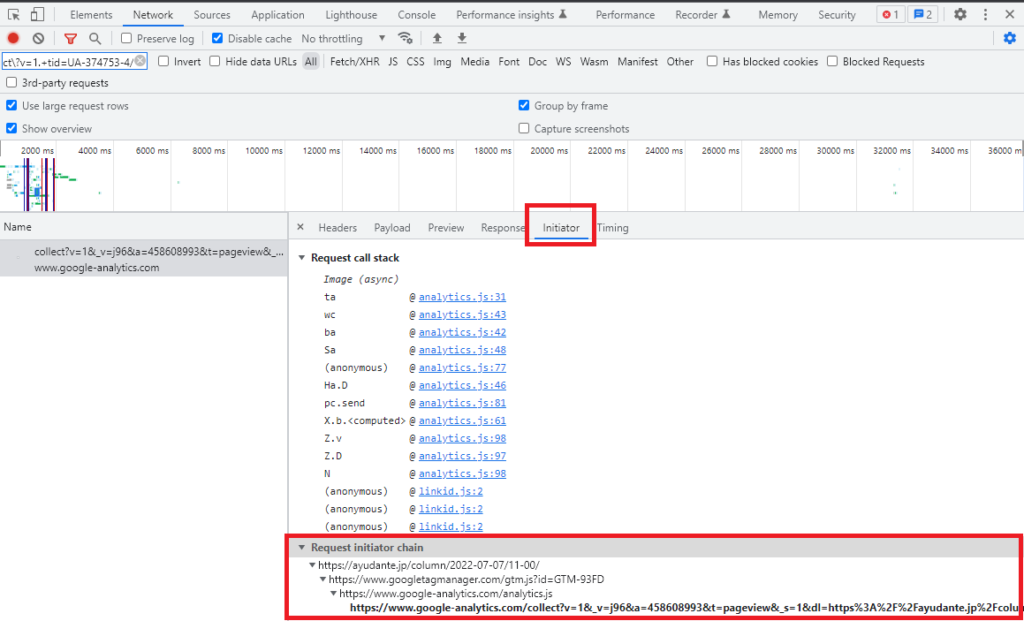
Have you ever wanted to investigate whether a communication from a measurement tag on a page was triggered by code directly embedded in the site’s HTML source, or if it was triggered by an external JavaScript file or code loaded via GTM?
In the Network panel, select the desired request log, right-click and open the “Initiator” tab, you can determine which source code triggered the communication. If you examine the content of the “Request initiator chain” for the previously filtered Universal Analytics communication using regular expressions, you can see that it is highly likely to have been invoked by “GTM code within the site’s source with the ID GTM-93FD.”
7. Functions for Each Control in the Network Panel
The functions of each control in the Network panel are as follows. You don’t need to memorize all of them, but feel free to try out any functions that interests you. The highlighted functions in the list are recommended features we frequently use.
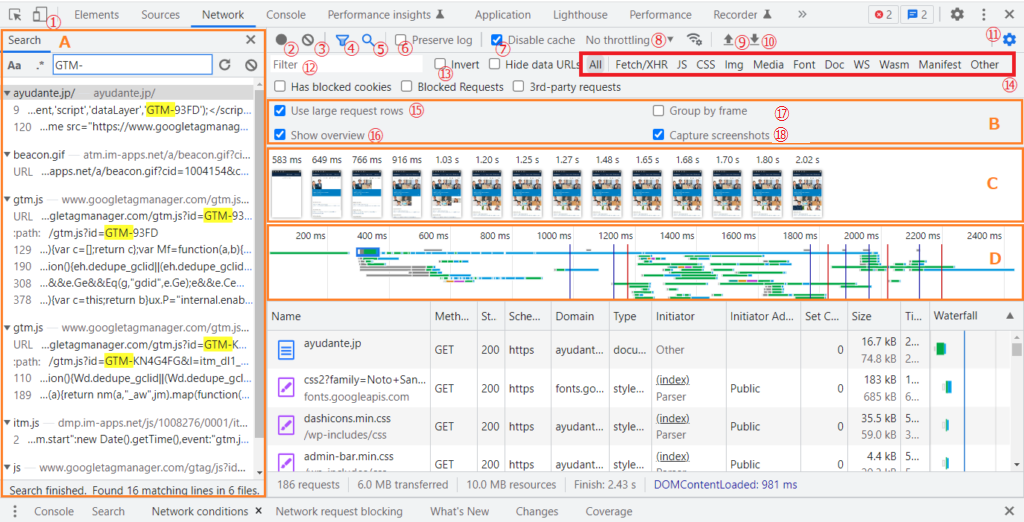
Toggle device toolbar: (① in screenshot) Switch the screen width and User-Agent, allowing you to simulate accessing websites as if you were using a smartphone or tablet.
Record network log: (② in screenshot) Click to start/stop recording the network log (red color indicates recording in progress, gray color indicates recording stopped).
Clear: (③ in screenshot) Clears all displayed network logs.
Show Filter menu: (④ in screenshot) Toggles Filter visibility for the controls (⑫~⑮)
Show Search menu: (⑤ in screenshot) Opens the functionality (marked as A in the diagram) for searching strings within the network content. It searches not only the Request URL but also Request Headers, Response Headers, and Response content.
Preserve log: (⑥ in screenshot) When checked, the network log will persist during page navigation or reloads.
Disable cache: (⑦ in screenshot) When checked, it disables the browser cache while the Developer Tools are active. It is recommended to keep this option disabled for validation purposes.
Throttling: (⑧ in screenshot) Allows you to test page loading under simulated slow network conditions, such as 3G.
Import HAR file: (⑨ in screenshot) Imports network logs from saved HAR (HTTP Archive) file
Export HAR file: (⑩ in screenshot) Exports the network traffic results to HAR file. It is useful for saving test results, sharing them, or reviewing them later.
Network settings: (#11 in screenshot) Toggles the visibility of the area (marked as B in the diagram) where you can make changes to the settings (⑮~⑱).
Filter: (#12 in screenshot) Allows you to filter the network results based on a string contained in the Request URL.
Invert: (#13 in screenshot) When checked, it inverts the filtering results from ⑫. It switches to displaying only the network logs that did not match the filter.
Type filter: (#14 in screenshot)Limits the displayed network traffic to specific resource types. For example, you can limit it to “Doc” (Documents) or JS (JavaScriptfile) if you want to check for redirects.
Use large request rows:(#15 in screenshot) When checked, allows you to view the uncompressed size of resources. The dim colored number displayed below the Size column cell represents the uncompressed size.
Show overview: (#16 in screenshot) When checked, it displays the area indicated as D in the diagram. Each horizontal line in D represents the completion of HTML loading and parsing (DOMContentLoaded), and the completion of page loading, including external resources like images (Load). If multiple documents are loaded within iframes or similar elements, multiple lines will be displayed. You can also click and drag to select an area, to narrow down the display to the corresponding network traffic only.
Group by frame: (#17 in screenshot) Allows grouping of network traffic by frames within a page (think different content loaded within iFrames)
Capture screenshots: (#18 in screenshot) When checked during the page load, it displays the area indicated as C in the diagram. Hovering over an image, a yellow vertical line appears at the corresponding timeline in D. Double-click on a screenshot to enlarge.
8. Conclusion
Chrome DevTools has a vast array of features that can be challenging to remember, but each feature is designed to be easily accessible with just a few clicks. Having a general awareness of these features can significantly impact the breadth and efficiency of your troubleshooting, testing work. I hope this article serves as a starting point for discovering useful features in the Network panel that you may not have been aware of. If you want to delve deeper and learn more, I encourage you to refer to the official documentation Network features reference – Chrome Developer