日本語版はこちら
Last year, we have carried out an SEO renewal project for the Japanese stock photo, illustration and video website “PIXTA”. After the renewal, the rankings and organic traffic has been steadily going up, and since, our customers have been monitoring the website performance regularly to find issues or possibilities for improvement.
In this article, we introduce a simple dashboard we have created to monitor SEO related metrics using Google’s BI tool Data Studio.
- Monitoring SEO performance
- Preparation for monitoring: Filtering and Grouping
- Problems in monitoring Google Search Console and Google Analytics data, and how to solve them with Data Studio
- How to create an SEO dashboard with Data Studio
- Problematic points of a Data Studio report
- Our customers’ thoughts after having used the Data Studio dashboard.
Monitoring SEO performance
A lot of monitoring for SEO can be done using Google Analytics and Google Search Console data. Other tools may be used as well, however for the purpose of this article we will line out an example with Google Analytics and Google Search Console data.
In Search Console, impressions, clicks, click through rate and rank may be viewed by, among others, device, landing page or query. For example, for highly ranking pages with a low click rate, we may find that the landing page does not correspond to searchers’ needs, or that the search snippet is not appealing enough. Checking the match of the landing page to user needs and improving the page title or description may increase the click rate, and hence the traffic.On the contrary, when the rank is low, but the click rate is high, strengthening page content and increasing inbound links to improve the rank may also increase traffic.
In Google Analytics, the landing page report for organic traffic is an important report, where the number of sessions, metrics regarding user behavior within the website, and conversion metrics may be viewed. A page that has high traffic but also a high bounce rate on an ecommerce website, such as PIXTA, may mean that, for example, users are having trouble finding the products which they were looking for. If this were the case, improving which products are shown and how they are shown on the first page may decrease the bounce rate and eventually increase the possibility of conversion.
Monitoring allows us to find issues as in the examples above, make website improvements, and measure the outcome.
Preparation for monitoring: Filtering and Grouping
In order to make sense of the data, especially for large websites like PIXTA which have a very high page count, it becomes necessary to group or filter the data.
For example, if we just look at the pages by traffic, we will have the top page, popular category pages, popular tags or blog pages, all of which perform a different role and answer to different user needs, and it may not make much sense to compare between these pages.
Therefore, we would first want to group pages by their functionality. The grouping would depend on your website, but in a case of an ecommerce website, we may for example group category pages, tag pages, product pages, blog pages, etc.
Further, for websites, like PIXTA, which carry different types of products, it may make sense to group by product type as well.PIXTA offers photo, illustration and video material, and users searching for these products have different needs and behavior, and pages in these categories seem to be evaluated differently by Google. Therefore, we monitor page performance by product type as well.
Problems in monitoring Google Search Console and Google Analytics data, and how to solve them with Data Studio
1. Filtering and grouping difficulties
In case of PIXTA, pages related to photographs always include “/photo” in the URL, illustrations include “/illustration” and videos - “/footage”, so it is very easy to filter for each of these URLs both in Google Analytics and Search Console.
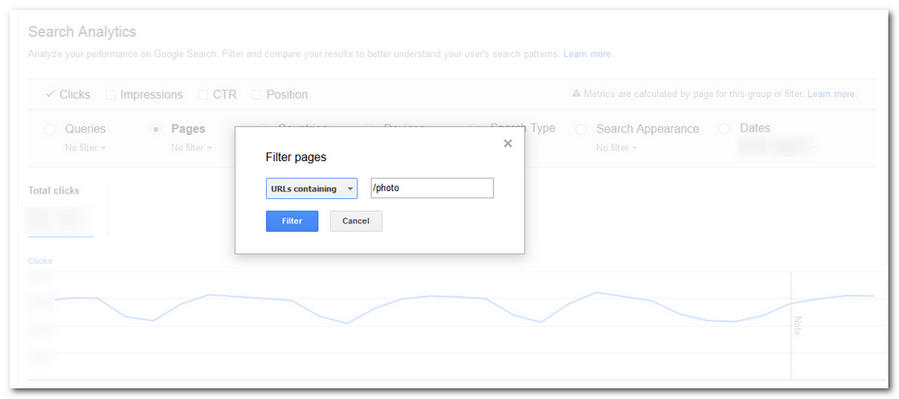
However, in Search Console, there are scenarios when filtering is not possible. For example, if we want to compare the performance of the top pages for each of these product categories, there isn’t a way to use regular expressions or multiple rules at the same time, so easy comparison in the user interface is not possible.
Further, if we want to see all category data, in case of PIXTA there are 3 layers of categories, with the URL rules for the lower 3rd level being “/c{categoryID}/ c{categoryID}/ c{categoryID}” with hundreds of category IDs existing. As we cannot use regular expressions, we cannot view multiple or all category data at once.
In Data Studio, you can use both multiple AND or OR rules, and regular expressions, so filtering Search Console data is an easy task.
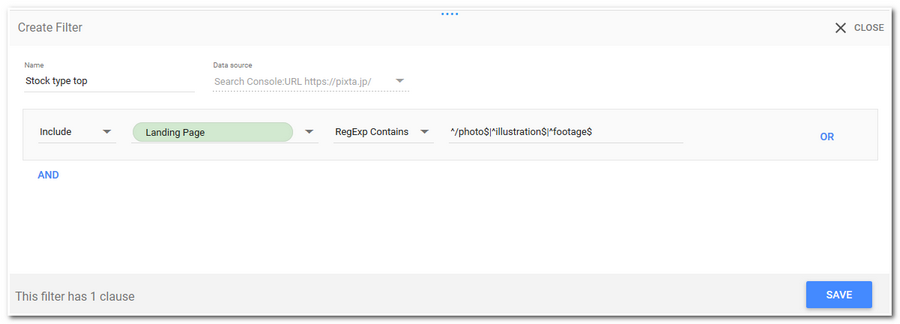
Further, you can also use Google Analytics segments on Google Analytics data within Data Studio, as well as Data Studio filters, which filter data on a hit level, something that segments cannot do.
2. Row limits and low data accuracy
In the Search Console user interface, you can only view 1000 rows of data.
Data Studio pulls data through the Search Console API, which alleviates this limit, and up to 100,000 rows of data can be displayed.
Further, the accuracy of Search Console data is higher when using the API (according to a Google representative at a SEO meetup in Japan), therefore Data Studio allows you to view data more accurate than the Search Console user interface.
3. Efficiency and presentation
Using Google Analytics and Search Console means using two tools with distinct user interfaces, and switching between these and filtering costs time and effort.
In Google Analytics, you can create custom reports or saved reports (previously known as shortcuts), which can save you a lot of time. However, there are some inconveniences such as, for example, that if you set up a filter for a tab of a custom report, this filter will be applied to other tabs in that report as well, so if you want to set up different filters for parts of the data, you have to create additional reports, and switch between them in monitoring.
With Search Console, there isn’t a similar custom report tool, and you must either manually filter, download the report to, for example, Excel to dissect it, or use an external tool to visualize data pulled via the Search Console API.
Further, if you need to share your monitoring results with executives or other teams, downloading and visualizing the data becomes a must.
All of this means extra effort and time, as well as in some cases requiring a level of technical expertise, which makes creating a monitoring report not very straightforward.
With Data studio, you can include data from different data sources on one page and use a different filter on each piece of data, which means that there is no need to switch between multiple tools and reports. The data is updated in near real time, so manual tasks such as re-pasting it to an Excel sheet is no longer required.
Using Data Studio is very straightforward, dragging and dropping or choosing dimensions from a pulldown to create your report, and no technical expertise is required. (Understanding regular expressions is useful)
You can add your logo, or change the colors, so your report is not only useful, but looks presentable, and you can share your report easily, even with someone who doesn’t have access to your Google Analytics or Search Console accounts, without a need to install any software. You can also copy or duplicate your report quickly if you have multiple websites or are an agency, which is another great plus.
How to create an SEO dashboard with Data Studio
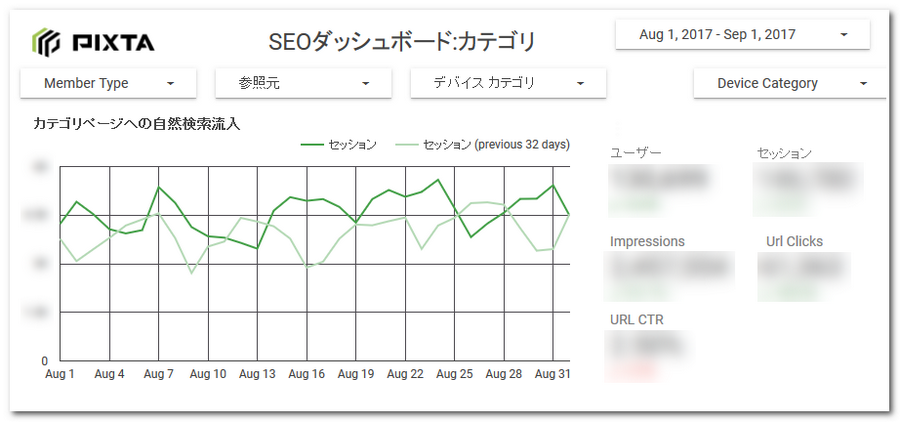
Here I outline the creation of an SEO dashboard with Data Studio with the example of the report we created for monthly monitoring meetings for PIXTA team members.
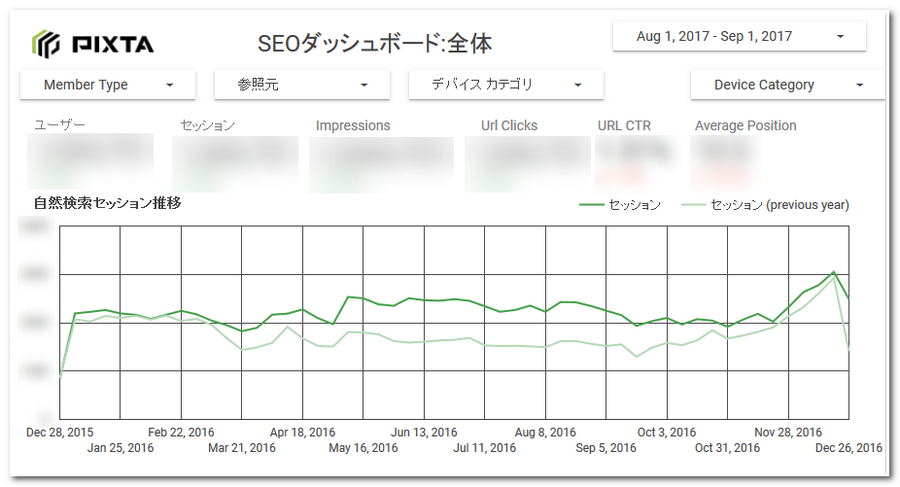
First, we wanted to have an overview of the overall organic traffic to the website, therefore we displayes the overall organic user and session numbers from Google analytics, as well as impressions, clicks, click rate and average position from Search console. We added a time comparison to previous period to be able to spot any changes to our core metrics with one look.
For sites with strong seasonal trends, like PIXTA, it is helpful to have a YOY comparison, therefore we added a graph of organic sessions in the current year as compared to previous year.
Following, we added query and landing page data from Search Console, and landing page data from Google Analytics. Further, to evaluate page groups by functionality and product type, we had set up content groups in Google Analytics, and added these to the Data Studio report.
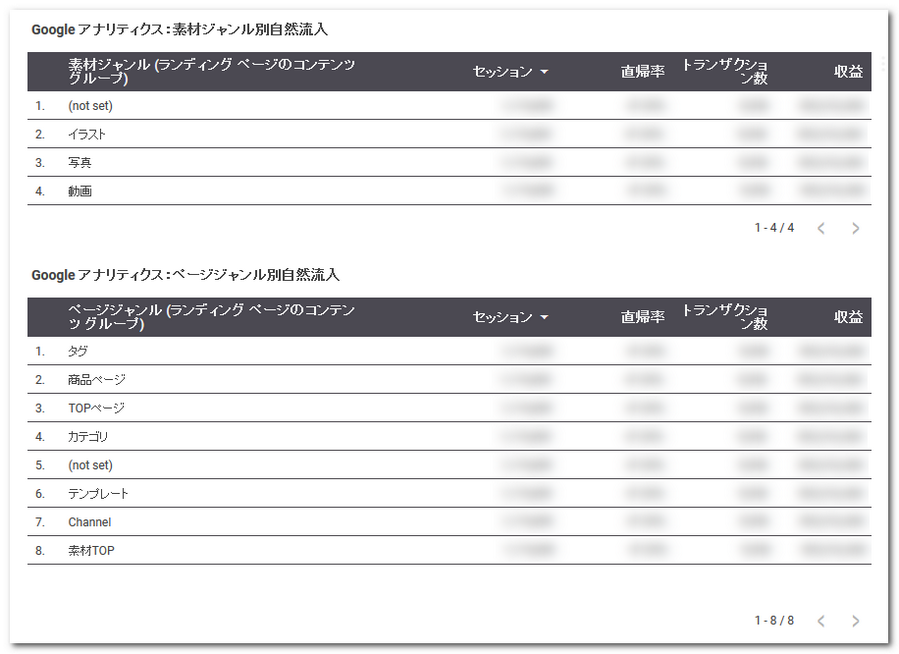
*in Data Studio, we can easily filter out the “(not set)” data, however we are leaving this in to see how the pages not grouped in any of our preset groups perform.
For these summary pages, we are using the Google Analytics’ organic traffic segment, and adding a filter control to filter data by device or source. PIXTA also have a member type custom dimension to differentiate regular users from creators, so we have also included it.
*Filter controls are specific to a data source, so we had to add two device filter controls - one for Search Console and one for Google Analytics data.
After looking at the overall performance of the website, we are ready to dive into performance by page type. We have created similar pages to report on each page group, including metrics we are most interested in seeing. We added one page each for photography, illustration and footage pages, as well as one page each for page genres (category, tag, product pages).
For each of these, we added a graph of organic sessions for the past 30 days, and session, user, impression, click and click rate score cards with a comparison to previous period.
We also added tables including Search Console data and Google Analytics data by landing page, also including transactions and revenue.
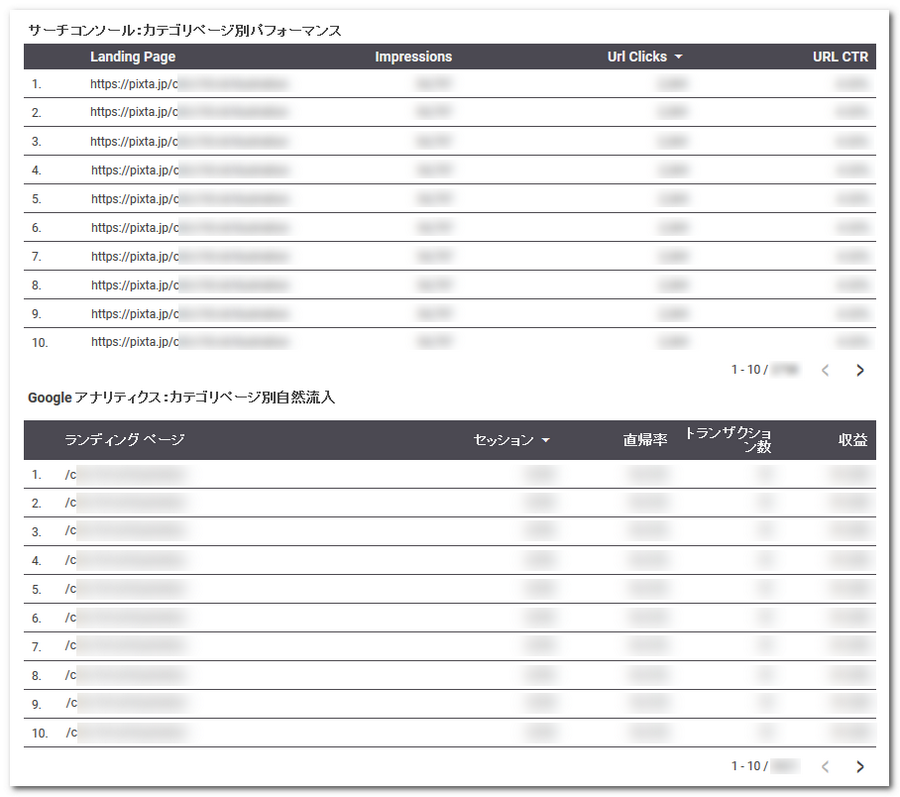
For these pages, we have added segments for organic traffic to the landing pages of interest in the Google Analytics interface, and have subsequently linked these to Data Studio to use on the Google Analytics data. For Search Console data, we used regular expression filters in Data Studio to limit data to the pages of interest.
This dashboard is very simple, but it allows us to view and share important data quickly, without the need to switch between interfaces and reports.
First, it allows us to see the overall performance and changes in trends, then it shows us main metrics by page type and allows us to find potential issues. When we find data that needs more exploration, we could then move to the necessary Google Analytics or Search Console reports to perform analysis on it.
Problematic points of a Data Studio report
There are many merits in using Data Studio, but there are also some things that should be kept in mind. Below are some of the important points we must take into consideration when creating an SEO dashboard.
-You cannot merge data from different data sources in one table
In Data Studio, you can display data from different sources on one page, however you cannot, as for example in Tableau, use the landing page URL as a key to join Search Console and Google Analytics data in one table.
-Search Console data is only available for the 3 last months
Data Studio does not store data, therefore you get the same limit of three months of data as in the Search Console user interface. To get more data, you could store your Search Console data in a database, and access it from Data Studio.
-Sampling of Google Analytics data
Acquiring data via the Google Analytics Core Reporting API means that you may hit sampling, and currently data is sampled at 1,000,000 sessions. Further, a sampling alert is not shown, so you should be careful when looking at large amounts of data.
If you are using Google Analytics 360, there are ways of overcoming the sampling issue, such as obtaining data via BigQuery, or downloading unsampled reports and feeding data into Data Studio through Sheets.
Our customers’ thoughts after having used the Data Studio dashboard
The PIXTA team members have started using the dashboard, and these were their thoughts.
Having joined Google Analytics and Search Console, it looks like understanding trends will become faster, and everyday monitoring – smoother.
I used to pull and process data every week, but having compiled metrics we usually look at in monitoring in one dashboard, it looks like reporting will become seamless.
By summarizing data by sections, looking at overall value, by directory, device or product type, it has become easier to pinpoint where changes are happening.
PIXTA is a multilingual website, and if we create one dashboard, by simply copying it we can easily create dashboards for the other language sites as well.
We can look at the trends on different language websites by looking at the same metrics.
-It’s easier to see data from GA and Search Console at once (reduces the time and effort to switch)
-Changing the time period for a graph is faster than GA!? It’s very quick.
-It’s easy to look at with data organized by pages .(No time and effort needed to switch metrics)
In everyday monitoring, it was extremely troublesome to extract and check SC and GA data. But now I’m surprised to see it possible to view all the data at once in one dashboard. I’m very happy!
With this very simple and easy to make dashboard, we could help our customers in their everyday SEO monitoring efforts.
Try creating a dashboard in Data Studio and see how this works for you!